Breeding for Tomorrow × Climate Data Hub · Phase 1 (datasets)
Crop Risk Index — dataset review & CDH integration recommendations
A dataset-by-dataset review of the 23 climate and environmental data layers behind the B4T Crop Risk Index (CRI), with modern, openly-available alternatives that the Climate Data Hub can realistically host — and an honest account of what is not yet known.
Who this is for
B4T domain leads (champion: Bert Lenaerts, IRRI); the CDH technical team — who also use it to prioritise which datasets to bring into the Climate Data Hub; methods reviewers; and data providers. Written to be read by breeders and data scientists alike.
The problem
The CRI blends data of very different ages and origins into one score — its future layers use CMIP5 / RCP8.5 climate models (a generation behind today’s CMIP6/SSP); horizons mix past, 2030 and the 2050s. That weakens comparability, credibility, and reuse.
How we address it
Review every input against its original source, then recommend modern open replacements — prioritising datasets the Hub already produces so they can be adopted quickly. Separate dataset problems from method problems.
Decisions it informs
Which inputs to keep, replace, or recompute; which datasets the Hub should catalogue; what to ask B4T; and the scope of a Phase-2 methodology review for 2026/27 planning.
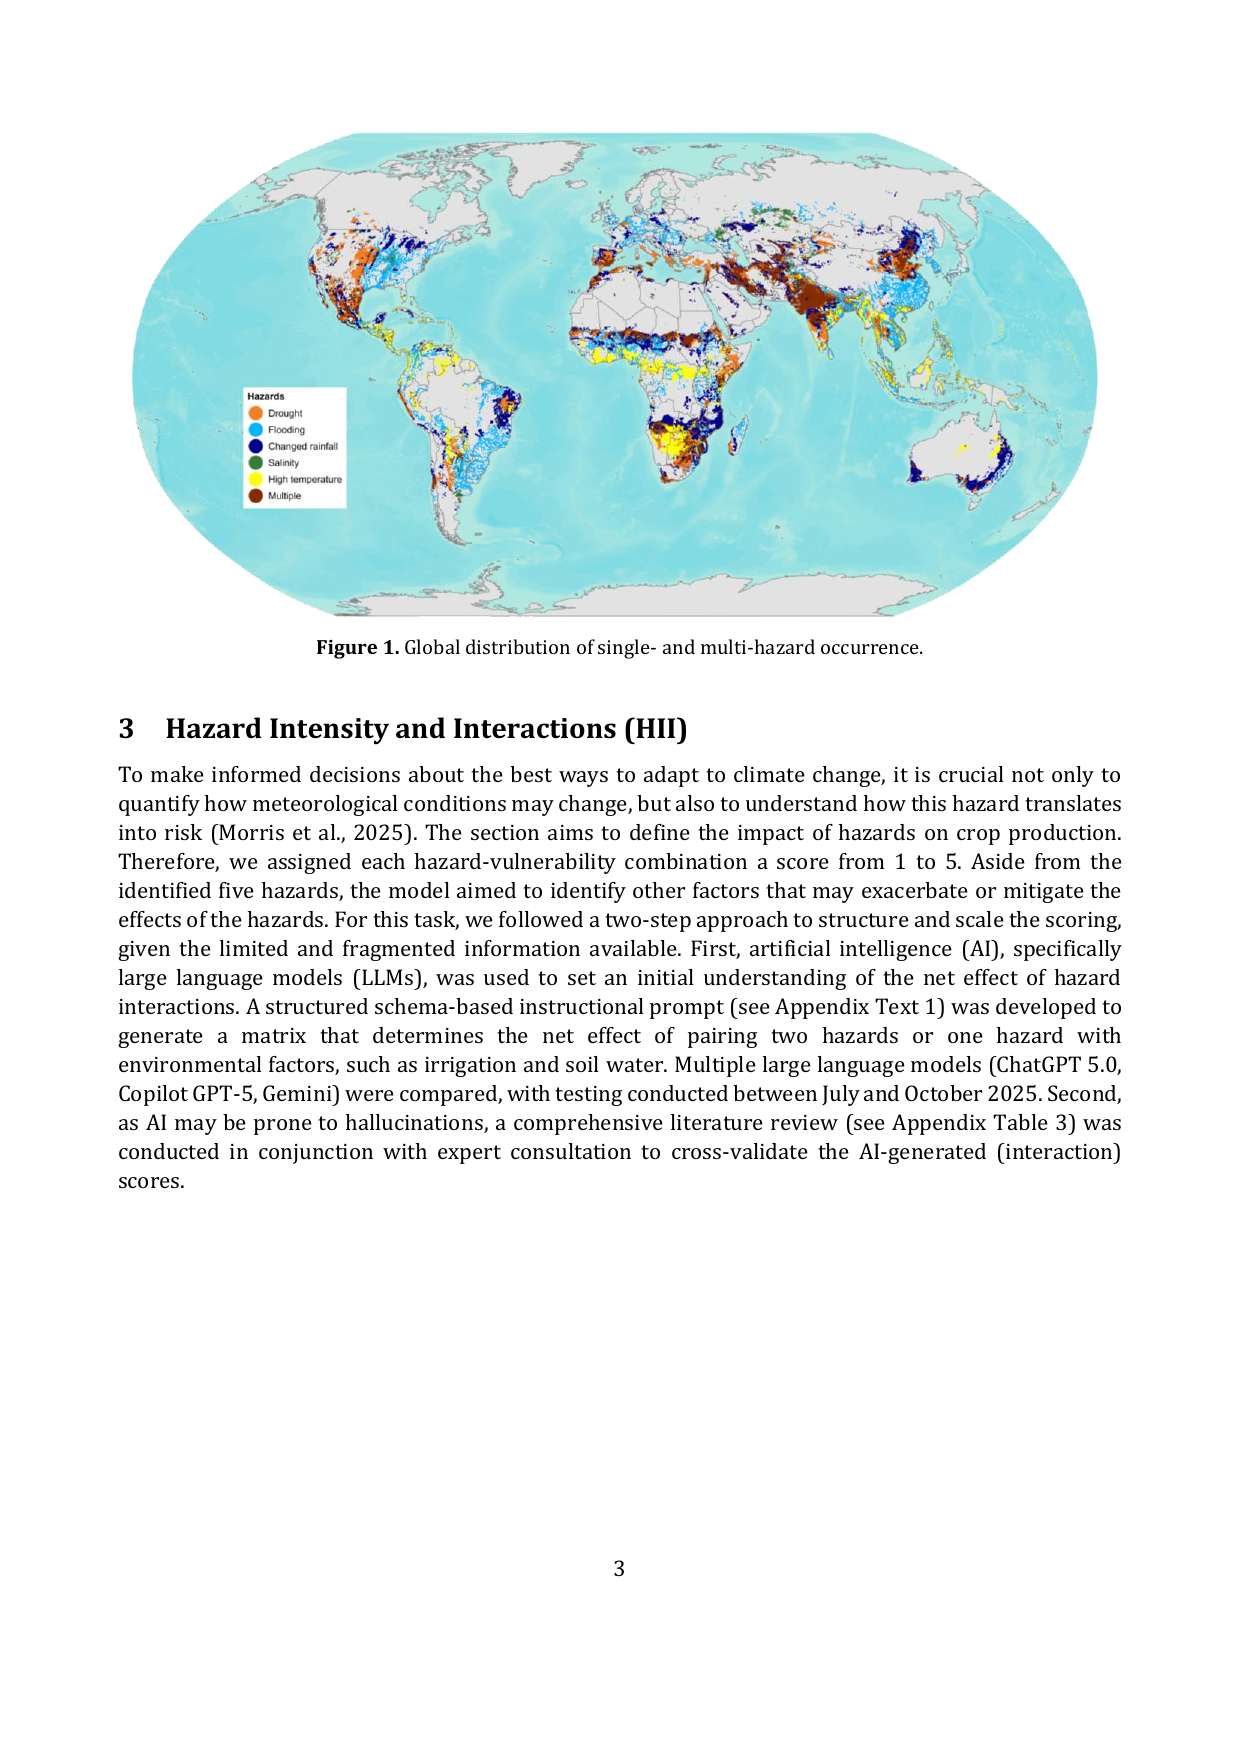
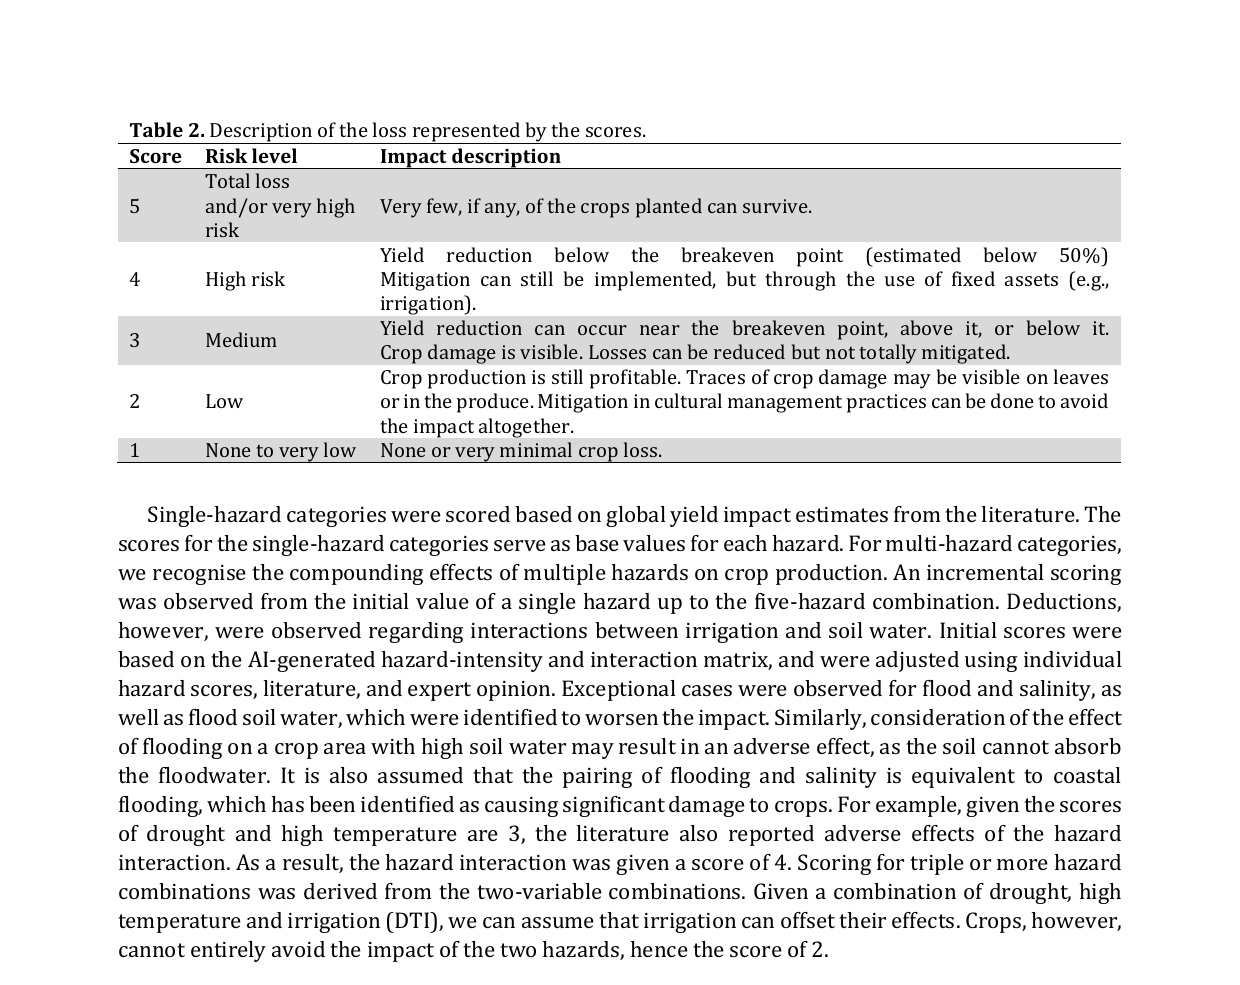
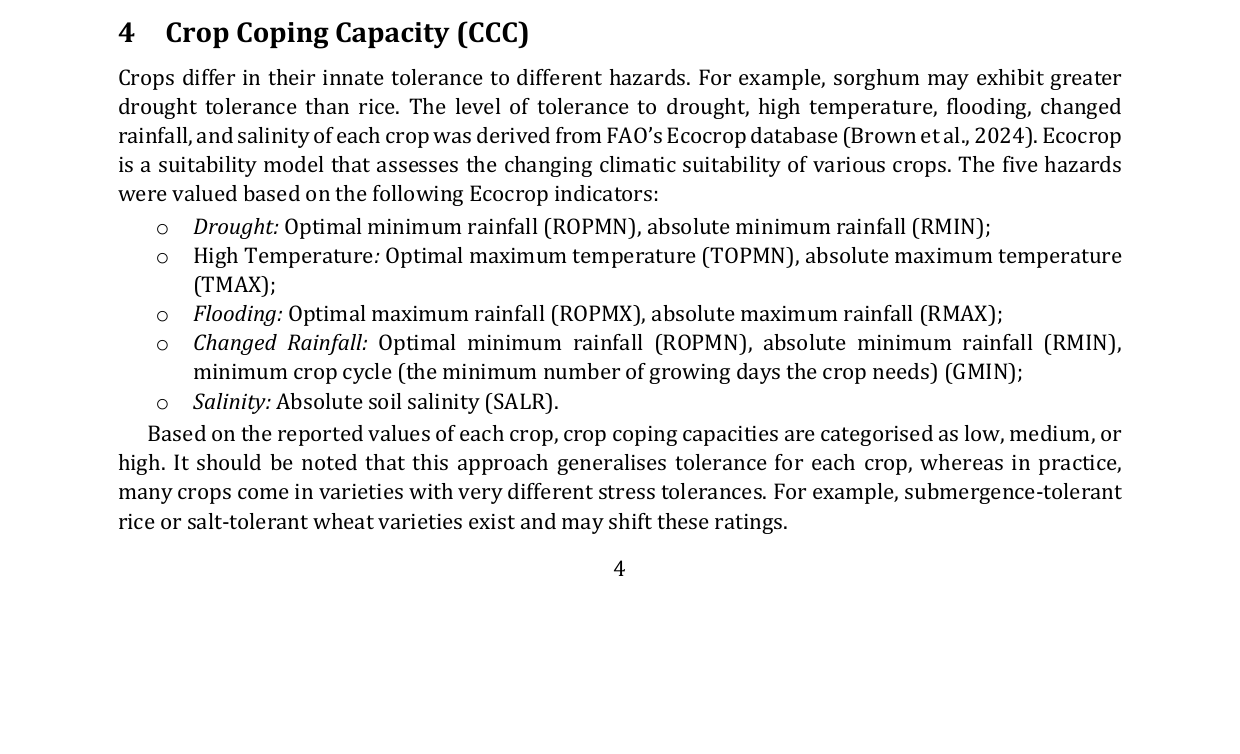
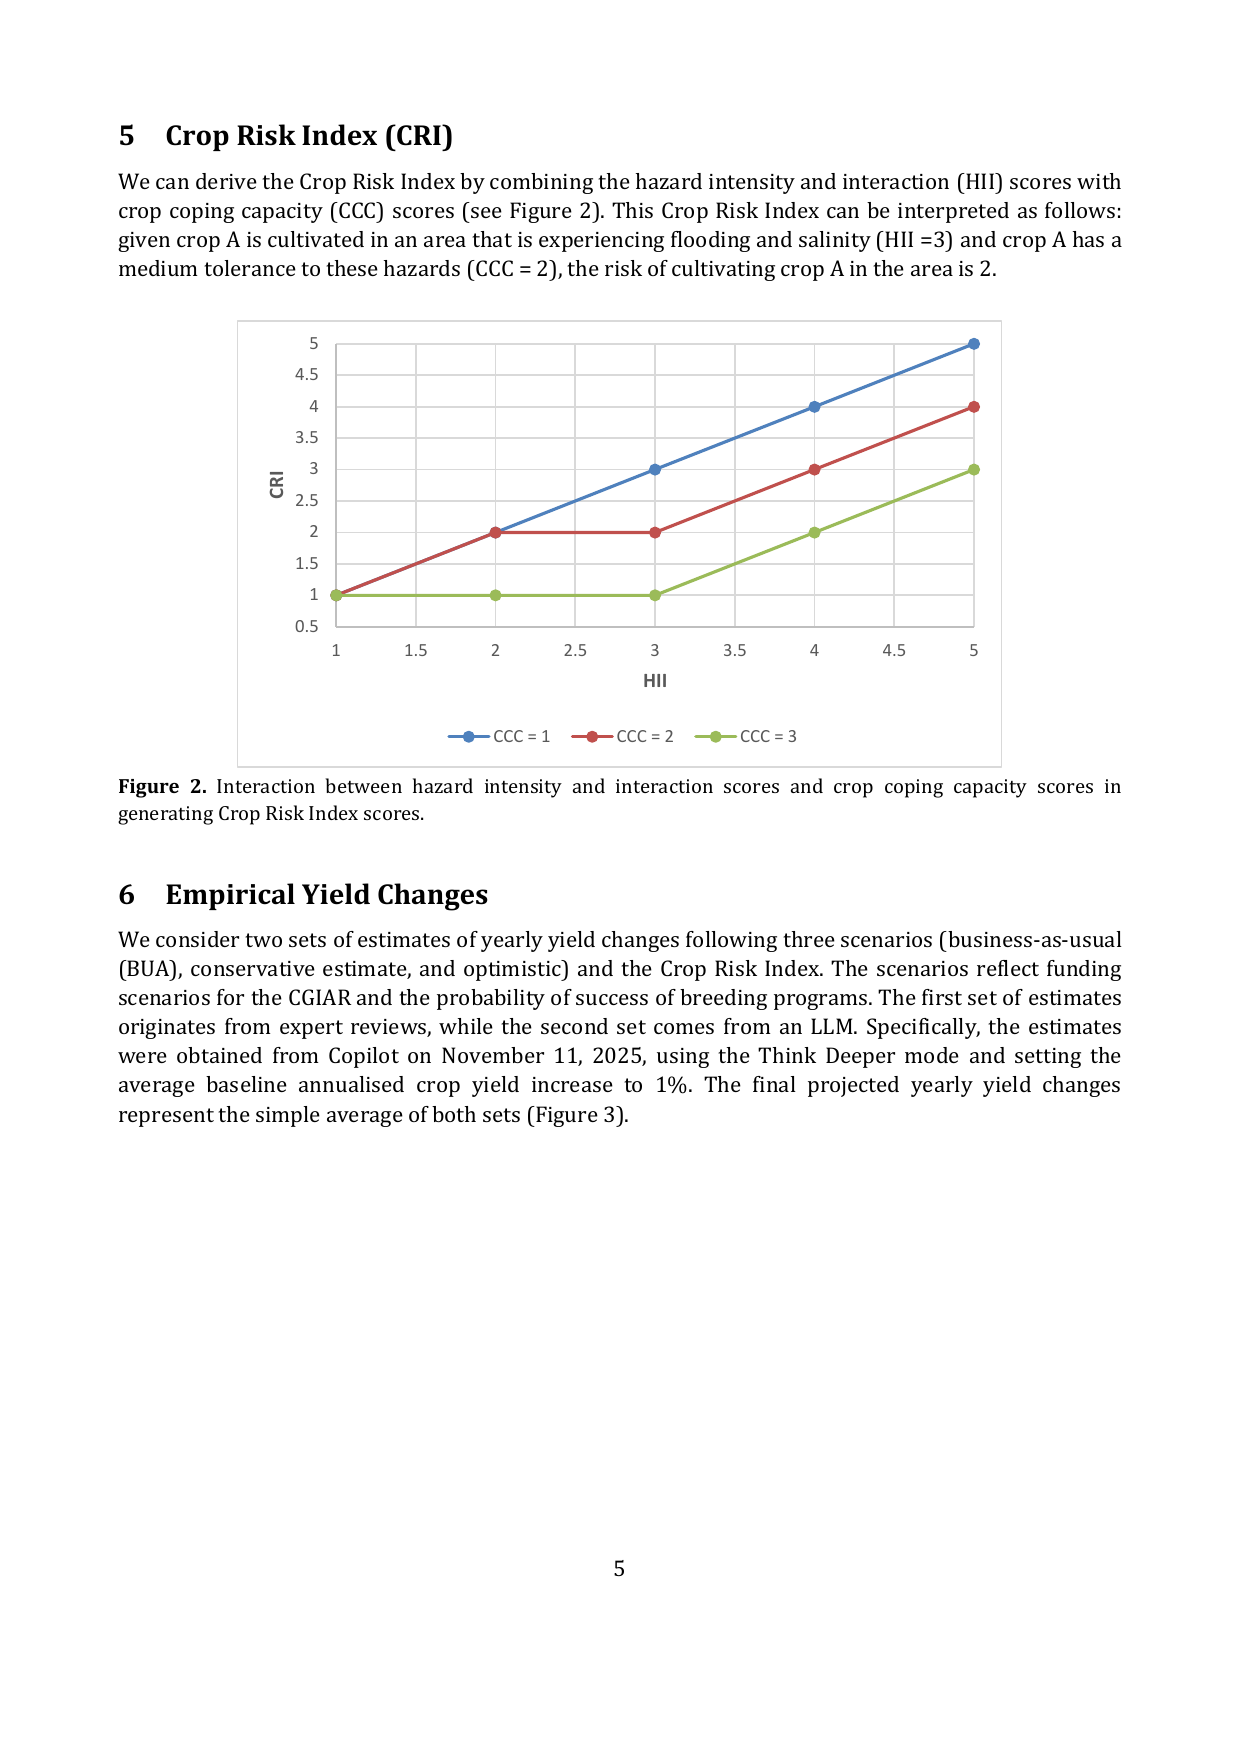
The CRI combines climate and environmental hazards (drought, flooding, high temperature, changed rainfall, salinity) with crop tolerance to score the risk of growing a given crop in a given place. It already feeds B4T prioritization — so the quality and provenance of its inputs matter beyond background analysis. Full method summary: CRI formulation note; the source list: use-case brief.
How we keep it honest. Facts about current inputs come only from B4T’s own source documents; facts about alternatives come only from each dataset’s official pages, checked live and re-checked adversarially. Where B4T’s technical emails and the published CRI document disagree, the emails describe the actual data and take precedence — such conflicts are flagged. Anything unconfirmed is marked pending — never guessed.
💬 Comments on “Overview & context”
Decisions at a glance
Table 1. Verdict and CDH action for all 23 CRI datasets. Verdict (what the CRI should do): Keep already modern & open · Replace / Re-derive modernize · Clarify need B4T input · Legacy CMIP5 / RCP8.5. CDH action = what the Hub should do. How used — how the variable enters the CRI (a neutral category, not a judgement): Baseline a historic/observed value · Change the baseline→future difference (threshold flips) · Future a future projection value; each hazard blends these (the CRI’s 50-50 present/future design). Sortable (click a header), filterable; click a code to jump to its detail.
| Code | Variable | Hazard | How used | Verdict | CDH action | Effort |
|---|---|---|---|---|---|---|
| D-01 | SPI/WASP (drought-event frequency) | Drought | Baseline | Adopt SPEI — extend CDH global | Re-run CDH SPEI pipeline globally; ASI complementary | Low–med |
| D-02 | Failed season | Drought | Baseline | Clarify — confirm source & role | Confirm w/ B4T; WRSI if retained | — |
| D-03 | Available blue water | Drought | Future | Keep — Aqueduct 4.0 (CMIP6) | Catalogue-as-is; confirm version + slice | Low |
| D-04 | Gross water demand / net consumption | Drought | Future | Keep — Aqueduct 4.0 (CMIP6) | Catalogue-as-is; confirm version + slice | Low |
| D-05 | Baseline water stress | Drought | Future | Keep — Aqueduct 4.0 (CMIP6) | Catalogue-as-is; confirm version + slice | Low |
| F-01 | Dartmouth flood frequency | Flooding | Baseline | Replace — Global Flood Database | Ingest GFD (satellite-observed, GEE) | Low |
| F-02 | River flood hazard | Flooding | Future | Modernize → GIRI riverine (CMIP6) | Ingest GIRI (90 m, registration); Aqueduct Floods = CMIP5 alt | Med |
| F-03 | Coastal flood hazard | Flooding | Future | Modernize pending — coastal gap | No open CMIP6 inundation layer; open CMIP6 driver exists (Copernicus CDS sea-level indicators) → build, not off-the-shelf; keep Aqueduct Floods coastal meanwhile | Med |
| R-01 | LGP flip over 120 days | Changed rainfall | Change | Modernize → GAEZ v5 (CMIP6) | GAEZ v5 LGP; or derive from NEX-GDDP v2 | Med |
| R-02 | LGP flip over 90 days | Changed rainfall | Change | Modernize → GAEZ v5 (CMIP6) | GAEZ v5 LGP; or derive from NEX-GDDP v2 | Med |
| R-03 | Annual rainfall CV | Changed rainfall | Baseline | Re-derive on CHIRPS v3 | CHIRPS-derived annual CV (SPEI stack) | Low |
| R-04 | Intra-annual variability | Changed rainfall | Future | Keep — Aqueduct 4.0 (CMIP6) | Catalogue-as-is; confirm version + slice | Low |
| R-05 | Seasonal variability | Changed rainfall | Future | Keep — Aqueduct 4.0 (CMIP6) | Catalogue-as-is; confirm version + slice | Low |
| T-01 | Extreme humid heat days | High temperature | Baseline | Keep — GEHE (modern, open) | Catalogue-as-is; pair CMIP6 future | Low |
| T-03 | LGP-linked temperature stress | High temperature | Change | Clarify — duplicate of R-01 (drop/merge) | Confirm w/ B4T; drop or merge | — |
| T-02 | Growing-season Tmax flip 30 °C | High temperature | Change | Modernize → NEX-GDDP v2 (CMIP6) | Derive growing-season Tmax flip; GAEZ v5 alt | Med |
| S-01 | Salt-affected soils map | Salinity | Baseline | Keep — FAO GSASmap | Catalogue-as-is | Low |
| S-02 | Global soil salinity | Salinity | Baseline | Keep — ISRIC | Catalogue; clarify overlap w/ S-01 | Low |
| W-01 | Water retention at 1500 kPa | Soil water | Baseline | Keep — SoilGrids 2.0 | Update to SoilGrids 2.0 | Low |
| W-02 | Available water capacity | Soil water | Baseline | Keep — SoilGrids 2.0 | Update to SoilGrids 2.0 | Low |
| W-03 | Rooting zone water storage | Soil water | Baseline | Keep — Stocker 2023 | Catalogue (Zenodo); consolidate soil-water | Low |
| W-04 | Plant-available soil water | Soil water | Baseline | Keep — Gupta 2023 | Catalogue (Zenodo 6777126, CC-BY); consolidate | Low |
| I-01 | Area equipped with irrigation | Irrigation | Baseline | Keep — Mehta 2024 | Catalogue (Zenodo); projected AEI for future | Low |
💬 Comments on “Decisions at a glance”
Current inputs
Each dataset’s current lineage on twelve axes. Where a modern alternative is recommended, it appears directly beneath as a shaded → rec row (→ alt = agriculture-specific alternative), so old and new line up on identical axes. Rows recommended as Keep (already modern & open) carry no → row — the current row stands.
In plain terms: “CMIP” is the generation of coordinated global climate-model experiments — higher numbers are newer and better-supported. The rust-shaded cells mark the future CMIP5 / RCP8.5 layers (17 CMIP5 models, per Philip Thornton; the * flags that this provenance is not fully confirmed — B4T is unsure, and it may in part be older). They are a generation behind today’s CMIP6/SSP standard, so they are prime modernization targets. The drought layer (D-01) is WASP — a coarse 2.5° precipitation-deficit index, not the “SPI” the document calls it. Rows marked pending are not yet verified in detail; shown honestly rather than guessed.
Table 2. Current-state lineage of the 23 inputs on twelve axes — what the CRI uses now, from B4T source documents and corrected against the B4T technical emails (which describe the actual data). Recommendations are not shown here — they are in §2 Decisions at a glance and §6 Dataset details. In Downscaling / bias-correction: a named technique (delta, quantile-mapping, neural-net, …) where known; present (…) = a step was applied but the technique is not stated in available sources; none = no climate downscaling/bias step; N/A = not applicable to a historical/observational layer; not stated = that lineage detail is not given in the source documents — a gap in the current-input record, not an incomplete review (every dataset has a verdict in §2 and §6). CMIP5* = provenance not fully confirmed (moot — CMIP5/pre-CMIP6 layers are replaced by default). Rust cells = pre-CMIP6/RCP8.5 legacy → replace. Specifics behind the `present`/`none` values: the CCAFS/Thornton future layers (R-01/02, T-02/03) apply Jones-&-Thornton statistical downscaling and bias-correction but the exact technique is not stated in the sources; F-02 applies bias-correction to rainfall only; W-01’s pedotransfer (random-forest) is soil modelling, not a climate step, hence `none`. The How-used chip on each variable — Baseline (historic value), Change (baseline→future difference), Future (future projection) — says how the CRI ingests it. Dataset reference is the dataset's own history used to build the layer, so a row can carry a reference period yet be used as Future (e.g. the Aqueduct rows).
| Code | Hazard | Variable | Res. | Dataset reference | Ref. period | Future dataset | Future period | Scenario | CMIP | Downscaling / bias | GCM ensemble |
|---|---|---|---|---|---|---|---|---|---|---|---|
| D-01 | Drought | SPI/WASP (event freq.) Baseline | 2.5° → 0.05° | WASP (IRI); Dilley 2005 — doc: SPI/Ericksen | 1980–2000 (doc 1974–2004) | N/A | N/A | N/A | N/A | N/A | N/A |
| D-02 | Drought | Failed season Baseline | not stated | Hyman et al. 2025 (mis-cite) | 100 years | N/A | N/A | N/A | N/A | not stated | N/A |
| D-03 | Drought | Available blue water Future | sub-basin | PCR-GLOBWB 2 (obs-forced) | 1960–2014 (GCM hist) | Aqueduct 4.0 (CMIP6) | 2030 (·2050·2080) | SSP1-2.6 / 3-7.0 / 5-8.5 (B4T slice TBC) | CMIP6 (confirm v4.0) | bias-corrected to obs | 5 GCMs (GFDL-ESM4, IPSL-CM6A-LR, MPI-ESM1-2-HR, MRI-ESM2-0, UKESM1-0-LL) |
| D-04 | Drought | Gross water demand Future | sub-basin | PCR-GLOBWB 2 (obs-forced) | 1960–2014 (GCM hist) | Aqueduct 4.0 (CMIP6) | 2030 (·2050·2080) | SSP1-2.6 / 3-7.0 / 5-8.5 (B4T slice TBC) | CMIP6 (confirm v4.0) | bias-corrected to obs | 5 GCMs (GFDL-ESM4, IPSL-CM6A-LR, MPI-ESM1-2-HR, MRI-ESM2-0, UKESM1-0-LL) |
| D-05 | Drought | Baseline water stress Future | sub-basin | PCR-GLOBWB 2 (obs-forced) | 1960–2014 (GCM hist) | Aqueduct 4.0 (CMIP6) | 2030 (·2050·2080) | SSP1-2.6 / 3-7.0 / 5-8.5 (B4T slice TBC) | CMIP6 (confirm v4.0) | bias-corrected to obs | 5 GCMs (GFDL-ESM4, IPSL-CM6A-LR, MPI-ESM1-2-HR, MRI-ESM2-0, UKESM1-0-LL) |
| F-01 | Flooding | Dartmouth flood freq. Baseline | ~1° → 0.05° | Dartmouth Flood Obs. (Dilley 2005) | 1985–2003 | N/A | N/A | N/A | N/A | N/A | N/A |
| F-02 | Flooding | River flood hazard Future | not stated | ISI-MIP forcing | — | ISI-MIP (GCM×RCP) | 2030 (2010–49) | RCP8.5 | CMIP5-era | present | not stated |
| F-03 | Flooding | Coastal flood hazard Future | MERIT 30″ → 0.05° | GTSR water levels | 1979–2014 | SLR projection | 2030 | RCP | CMIP5-era | not stated | not stated |
| R-01 | Changed rainfall | LGP flip >120d Change | 0.05° | Thornton baseline (Jones & Thornton) | ~2000s | Downscaled CMIP5 (Jones & Thornton) | 2050s | RCP8.5 | CMIP5* | present | 17 CMIP5 GCMs (Thornton; uncertain) |
| R-02 | Changed rainfall | LGP flip >90d Change | 0.05° | Thornton baseline (Jones & Thornton) | ~2000s | Downscaled CMIP5 (Jones & Thornton) | 2050s | RCP8.5 | CMIP5* | present | 17 CMIP5 GCMs (Thornton; uncertain) |
| R-03 | Changed rainfall | Annual rainfall CV Baseline | 0.05° | Observed rainfall (Dilley 2005 / Thornton) | Historic | N/A | N/A | N/A | N/A | N/A | N/A |
| R-04 | Changed rainfall | Intra-annual variability Future | sub-basin | PCR-GLOBWB 2 (obs-forced) | 1960–2014 (GCM hist) | Aqueduct 4.0 (CMIP6) | 2030 (·2050·2080) | SSP1-2.6 / 3-7.0 / 5-8.5 (B4T slice TBC) | CMIP6 (confirm v4.0) | bias-corrected to obs | 5 GCMs (GFDL-ESM4, IPSL-CM6A-LR, MPI-ESM1-2-HR, MRI-ESM2-0, UKESM1-0-LL) |
| R-05 | Changed rainfall | Seasonal variability Future | sub-basin | PCR-GLOBWB 2 (obs-forced) | 1960–2014 (GCM hist) | Aqueduct 4.0 (CMIP6) | 2030 (·2050·2080) | SSP1-2.6 / 3-7.0 / 5-8.5 (B4T slice TBC) | CMIP6 (confirm v4.0) | bias-corrected to obs | 5 GCMs (GFDL-ESM4, IPSL-CM6A-LR, MPI-ESM1-2-HR, MRI-ESM2-0, UKESM1-0-LL) |
| T-01 | High temperature | Extreme humid heat days Baseline | 0.05° (~5 km) | Tuholske 2023 GEHE (WBGT; SEDAC) | 1983–2016 | N/A | N/A | N/A | N/A | none (CHIRTS/WBGT) | N/A |
| T-03 | High temperature | LGP-linked temp stress Change | 0.05° | Thornton baseline (Jones & Thornton) | ~2000s | Downscaled CMIP5 (Jones & Thornton) | 2050s | RCP8.5 | CMIP5* | present | 17 CMIP5 GCMs · likely duplicate of R-01 |
| T-02 | High temperature | Tmax flip >30 °C Change | 0.05° | Thornton baseline (Jones & Thornton) | ~2000s | Downscaled CMIP5 (Jones & Thornton) | 2050s | RCP8.5 | CMIP5* | present | 17 CMIP5 GCMs (Thornton; uncertain) |
| S-01 | Salinity | Salt-affected soils Baseline | not stated | FAO GSASmap (Omuto 2020) | 1970–2005 | N/A | N/A | N/A | N/A | N/A | N/A |
| S-02 | Salinity | Global soil salinity Baseline | not stated | ISRIC (Ivushkin 2019) | 1986–2016 | N/A | N/A | N/A | N/A | N/A | N/A |
| W-01 | Soil water | Water retention 1500 kPa Baseline | not stated | ISRIC WoSIS (Batjes 2024) | 1918–2013 | N/A | N/A | N/A | N/A | none | N/A |
| W-02 | Soil water | Available water capacity Baseline | 250 m | SoilGrids250m (Hengl 2017) | 1950–2016 | N/A | N/A | N/A | N/A | N/A | N/A |
| W-03 | Soil water | Rooting zone storage Baseline | not stated | Stocker et al. 2023 | 2003–2018 | N/A | N/A | N/A | N/A | N/A | N/A |
| W-04 | Soil water | Plant-available soil water Baseline | not stated | Gupta et al. 2023 | 1979–2016 | N/A | N/A | N/A | N/A | N/A | N/A |
| I-01 | Irrigation | Area equipped w/ irrigation Baseline | not stated | Mehta et al. 2024 | 2000–2015 | N/A | N/A | N/A | N/A | N/A | N/A |
💬 Comments on “Current inputs”
Corrections from B4T technical emails
The B4T technical emails of 2026-04-29/30 (relaying Philip Thornton, pers. comm.) describe the actual data used and correct the published documentation, which lags:
- Drought (D-01) is WASP, not SPI — Weighted Anomaly of Standardized Precipitation (IRI), 2.5°, 1980–2000 (event = ≤50% of long-term median for 3+ months), high-risk from Dilley 2005 top-two-deciles. The doc's "SPI, 1974–2004, Ericksen" conflicts. Coarse 2.5° strengthens the modernization case.
- Future layers are CMIP5, not CMIP3 — the 2050s threshold-flips (R-01, R-02, T-02, T-03) used 17 CMIP5 GCMs, RCP8.5 (Jones & Thornton). Provenance uncertain (notebook flags "possibly pre-CMIP5") →
conflicted; pre-CMIP6/SSP either way. - Aqueduct may be older than cited — B4T flags the CRI "seems [to use] CMIP5" Aqueduct while the doc cites 4.0 (CMIP6); verify per row.
📄 Source & references
💬 Comments on “Corrections from B4T emails”
Potential weaknesses (data)
- Pre-CMIP6 / pre-SSP future layers (RCP8.5 / CMIP5); Aqueduct CMIP5–CMIP6 version to confirm.
- T-03 appears to duplicate R-01 — identical LGP-flip wording under a different hazard.
- “SPI” (D-01) is mislabelled — the actual index is WASP (a distinct IRI index).
📄 Source & references
💬 Comments on “Potential weaknesses (data)”
CDH integration
What the Hub does with each recommended dataset — catalogue as-is, ingest new, or derive in the pipeline — with a rough 1–5 feasibility rating. This feeds the “Data assets for the hub” table in the brief.
D-01 example: extend CDH's existing SPEI pipeline from Africa to global 0.05° — a re-run of a proven pipeline, not a new indicator. Feasibility ≈ 2/5 (modest compute/storage; no new method). Catalogue the resulting climatology/admin tiers.
Build on internal CDH assets first. The Hub already produces strong, ready-to-adopt datasets, and recommendations lean on these: the CHIRPS-CHIRTS-ERA5 SPEI observational track (drought/rainfall; produced for Africa, extendable to global — used for D-01); the NASA NEX-GDDP-CMIP6 v2 projections track (the natural CMIP6/SSP source for the future changed-rainfall and heat rows); and the water-balance v2 track (NDWS/NDWL, FAO-56 Penman-Monteith ET₀) for soil-water / water-stress rows. Bespoke new datasets can follow as later enhancements where needed.
Licences of recommended datasets
Load-bearing for whether CDH can catalogue / redistribute. CDH/CGIAR is a non-profit NGO doing non-commercial work, so non-commercial (NC) licences are usable — most datasets are cleanly available; only two genuinely need confirming.
Table 6. Licence per recommended dataset (verified against steward pages, 2026-07-03). ⚠ = restriction or unconfirmed — check before Hub redistribution.
| Recommended dataset | Rows | Licence | CDH host / redistribute? |
|---|---|---|---|
| CDH SPEI (internal) | D-01 | CDH-set (Hub owns) | Yes |
| CHIRPS v3 | D-01/R-03 input | Public domain + CC-BY 4.0 | Yes |
| NASA NEX-GDDP-CMIP6 | T-02; D-01/R-03/T-01 future | CC-BY 4.0 / CC0 | Yes |
| FAO GAEZ v5 | R-01/02; T-02 alt | CC-BY 4.0 (HWSD component CC-BY-NC-SA) | Yes (core outputs) |
| WRI Aqueduct 4.0 | D-03/04/05, R-04/05 | CC-BY 4.0 | Yes |
| WRI Aqueduct Floods | F-02/03 (current/alt) | Open, attribution requested | Yes |
| Copernicus CDS sea-level indicators | F-03 driver (Phase-2) | CC-BY | Yes |
| SPEIbase (cross-check) | D-01 | ODbL (attribution + share-alike) | Yes (share-alike) |
| L-WRSI / crop-WRSI | D-02 | CC0 1.0 / USGS public domain | Yes |
| GEHE (Tuholske) | T-01 | CC-BY 4.0 (NASA SEDAC — commercial & non-commercial) | Yes |
| ISRIC SoilGrids 2.0 | W-01/02 | CC-BY 4.0 | Yes |
| ISRIC salinity | S-02 | CC-BY 4.0 | Yes |
| Stocker 2023 (rooting zone) | W-03 | CC-BY 4.0 (Zenodo) | Yes |
| Mehta AEI + Gao projected AEI | I-01 | CC-BY 4.0 (Zenodo) | Yes |
| Global Flood Database | F-01 | CC BY-NC 4.0 (GEE) / CC BY-NC-ND (HydroShare) | Yes (non-profit) — use GEE CC-BY-NC, not the ND mirror |
| GIRI | F-02 | Non-commercial + attribution; registration | Yes (non-profit) — via registration |
| FAO ASI | D-01 alt | CC-BY 4.0 (supersedes old CC-BY-NC-SA 3.0 IGO) | Yes |
| Gupta 2023 (PASW) | W-04 | CC-BY 4.0 (Zenodo 6777126) | Yes |
| FAO GSASmap | S-01 | Not printed on product page — CC-BY 4.0 by FAO default policy; third-party carve-out may apply | ⚠ confirm on GloSIS |
💬 Comments on “CDH integration”
What this review doesn’t solve
That gap — hazard timing, crop-stage sensitivity, how hazard interactions are scored, crop-vs-variety tolerance, and the yield step — belongs to the Phase-2 methodology review, intended as the shared product-of-day (PoD) input for 2026/27 planning. This dataset review is the foundation it builds on, not the whole answer.
An existing asset for that work: CDH / the AAA Atlas already hold crop-relevant maximum-temperature (tmax) data that could support crop-specific temperature thresholds — so the crop-specificity question can also build on an existing product rather than start from scratch. To be scoped in the Phase-2 methodology review.
💬 Comments on “What this review doesn’t solve”
Dataset details
Each row is split into Present — the variable as the CRI defines it plus the data used now (source, resolution, period, scenario/CMIP where relevant, known issues) — and Recommended — the modern open alternative and the CDH action. Depth scales with the decision, but every row carries both sides so old and new line up.
D-01 — “Standardized Precipitation Index (SPI)” · drought-event frequency
📘 CRI Appendix Table 1 — verbatim definition
Drought is represented by the Standardised Precipitation Index (SPI), which represents the average number of drought events per year per pixel. Drought events are identified as three consecutive months with less than 50% of the average precipitation.
Verdict: Adopt SPEI — extend CDH pipeline to global 0.05° a re-run of the existing pipeline, not a new indicator; FAO ASI complementary; construct needs B4T sign-off.
The Hub already produces a suitable drought product — the CHIRPS-CHIRTS-ERA5 SPEI dataset — so the recommendation is to build on that existing asset rather than create a new layer.
- Dataset
- WASP (IRI) via Dilley 2005 — doc labels it “SPI” (Ericksen 2011)
- Resolution
- 2.5° (~275 km) → 0.05° grid
- Temporal
- 1980–2000 (doc: 1974–2004) · historic
- Scenario · CMIP
- N/A (observational)
- GCM ensemble
- N/A
- Access
- legacy / internal
- Status
- conflicted · not standard SPI · very coarse
- Dataset
- CDH SPEI (internal) — CHIRPS v3 + CHIRTS-ERA5; SPEI-03
- Access
- CDH Digital-Atlas — climatology COGs on S3 · adm0/adm1 parquet
- Resolution
- 0.05°
- Temporal
- 1981–present (ref 1991–2020)
- Scenario · CMIP
- N/A (observational)
- GCM ensemble
- N/A
- Licence
- internal (Hub-owned)
- CDH action
- Extend existing SPEI pipeline to global 0.05° (re-run) · effort Low–med · FAO ASI complementary
📄 Provenance, licence & sources
- Internal CDH SPEI (recommended for D-01): SPEI at 1/3/6/12/24-month scales; precip = CHIRPS v3 monthly, temp = CHIRTS-ERA5 (PET via Hargreaves 1985, FAO-56); reference period 1991–2020; native 0.05°, currently Africa (−20…55°E, −40…40°N), same pipeline extends global (CHIRPS bounds 60°N–60°S); 1981-01→present. No pure SPI produced. Caveat: SPEI ≠ SPI/WASP (adds evaporative demand, partly overlaps the heat hazard).
- CHIRPS v3 (CHC/UCSB), verified 2026-07-02: 0.05°, 60°N–60°S all longitudes (v2 was 50°), 1981–near-present; licence public-domain + CC-BY 4.0.
- SPEIbase (CSIC), verified 2026-07-02: SPEI = precip − PET (FAO-56 Penman-Monteith, CRU TS); 0.5°; 1901–2024; ODbL (attribution + share-alike).
- Metric note: standard SPI (McKee 1993; WMO-1090) is precip-only; SPEI adds PET. The CRI’s “≥3 consecutive months <50% of average precip” is a fixed-threshold run count — not SPI, not WMO-standard.
Full worked detail below — this row is resolved end-to-end to set the pattern.
Present — what the CRI uses now. Supplies the drought layer — the average number of drought events per year at each location, where an “event” is three straight months getting less than half the normal rainfall. It describes the recent past, not the future.
Present data — the sources conflict. Per the B4T technical emails (relaying Philip Thornton) (the actual data used), the drought layer is the Weighted Anomaly of Standardized Precipitation (WASP) from IRI, on a coarse 2.5° grid (~275 km) over 1980–2000, with high-risk areas from the top two deciles of Dilley (2005). The CRI document instead calls it “SPI” over 1974–2004. Either way:
- It isn’t really “SPI.” Standard SPI (McKee et al. 1993, WMO-endorsed) is a statistical index; WASP is a different IRI index, and the CRI layer is a count of dry spells. Publishing it as “SPI” misdescribes it.
- It’s very coarse. A 2.5° grid is roughly 275 km per cell — far coarser than the CRI’s 0.05° working grid, so today’s layer is heavily stretched to fit.
- The provenance is unresolved — WASP / 2.5° / 1980–2000 (emails) versus SPI / 1974–2004 (document). A real question for B4T.
Recommended — CDH’s existing SPEI product (internal Digital-Atlas observational track, CHIRPS v3 + CHIRTS-ERA5). Already produced and gridded — no new derivation. Spec per the CDH team (July 2026):
Table 4. The existing CDH SPEI product (CHIRPS-CHIRTS-ERA5 observational track) and its fit to the D-01 drought layer. Internal spec, CDH team, July 2026.
| Property | CDH SPEI product | Fit to the CRI |
|---|---|---|
| Index | SPEI at 1, 3, 6, 12, 24-month scales | SPEI-03 matches the CRI’s 3-month window — but it is SPEI, not SPI/WASP (see caveats) |
| Inputs | CHIRPS v3 precip + CHIRTS-ERA5 temperature; PET = Hargreaves 1985 | Adds evaporative demand (temperature), unlike the current precip-only layer |
| Resolution | 0.05° | Same as the CRI grid — ~50× finer than today’s 2.5° WASP |
| Coverage | Currently produced for Africa (−20…55°E, −40…40°N); the same pipeline extends to global | Global run bounded by CHIRPS to 60°N–60°S — covers essentially all B4T crop areas |
| Time span | 1981-01 → present; reference 1991–2020 | More current than 1980–2000; WMO/AR6 baseline |
| Availability | SPEI climatology COGs on S3 (digital-atlas); monthly per-pixel local only; adm0/adm1 parquet | Climatology + admin tiers ready to catalogue; monthly grids are local (Tier 3) |
Why this is the strong choice. It runs at the CRI’s native 0.05° on a proven, maintained CHIRPS-based pipeline — extending it from Africa to global is a re-run, not a new indicator, so it fits within capacity. It is also a genuine upgrade on the coarse 2.5° WASP layer: finer, more current, and temperature-aware. But it is not a like-for-like swap, and two decisions sit with B4T.
Caveats B4T must weigh. (1) It is SPEI, not SPI/WASP. SPEI subtracts evaporative demand (Hargreaves PET), so “drought” becomes temperature-sensitive — arguably better under warming, but it partly overlaps the CRI’s separate high-temperature hazard (possible double-counting — a Phase-2 question). (2) Coverage — extend globally. Currently produced for Africa, but the same pipeline re-runs at global extent (0.05°, bounded by CHIRPS to 60°N–60°S — covers essentially all B4T crops). A pipeline re-run within capacity, not a new indicator. (3) No pure SPI in the Hub yet — a precipitation-only index would be a new addition rather than an existing product.
SPEIbase (CSIC) as an independent cross-check. A ready global SPEI (1901–2024, 0.5°, open) — useful to validate the extended CDH product, but no longer needed for coverage now that the CDH pipeline can run globally at the finer 0.05°.
Best-in-class agriculture-specific alternative — FAO ASI (Agricultural Stress Index System). Unlike a generic climate index, FAO’s ASI is built for agriculture: it flags crop-season drought from satellite vegetation health (VHI), masked to cropland and timed to each area’s growing season. Global, 1 km, dekadal, 1984–present, operational at FAO, and open (Google Earth Engine, ArcGIS Online, FAO Agro-informatics Platform / WMTS). It directly answers the “relevant for agriculture” ask and, being crop-masked and season-aware, also points toward B4T’s crop-specific need. A cutting-edge multi-indicator cousin is the Copernicus Combined Drought Indicator (CDI) — precipitation (SPI) + soil-moisture anomaly + vegetation (fAPAR) anomaly, crop-masked, with Watch/Warning/Alert classes (global via the Global Drought Observatory; open). Trade-off to be explicit about: ASI and CDI measure realised crop/vegetation stress, a different construct from the CRI’s precipitation-deficit metric or SPEI’s climatic water balance — arguably the most decision-relevant for breeding, but a bigger change of meaning, and both are observational (present-climate), not future projections.
Recommended baseline (decision). Adopt SPEI as the drought-hazard index. Why SPEI and not ASI/CDI: the CRI's drought slot is a hazard layer, and the CRI already scores the crop's response separately as coping capacity — so the hazard should be the climatic water deficit (SPEI), not a realised-stress index like ASI/CDI, which risks double-counting the crop's response. (This is a defensible default rather than an absolute rule — it holds insofar as the coping-capacity layer is structural/socioeconomic and independent of vegetation stress; if it is, ASI/CDI could carry extra hazard information. Worth confirming against how CCC is actually built.) SPEI is also temperature-aware, which matters under warming. Deliver it by extending CDH's existing SPEI pipeline to global 0.05° (CHIRPS-CHIRTS-ERA5) — a re-run of a proven pipeline, not a new indicator, and within capacity. Coverage is bounded by CHIRPS to 60°N–60°S, which covers essentially all B4T crop areas (the practical availability caveat; a modest compute/storage cost for the global run). Keep FAO ASI (global, 1 km, crop-masked, open) as a complementary agriculture-specific / validation layer, with SPEIbase as an independent global cross-check. Get B4T sign-off on moving from the current precipitation-deficit count to SPEI, and stop calling it “SPI.”
💬 Comments on “Drought (D-01)”
Questions for B4T. Is temperature-aware SPEI acceptable for the drought hazard in place of the precip-only WASP layer (and does it overlap the heat hazard)? What covers the non-Africa footprint? And is the current layer WASP (2.5°, 1980–2000) or the document’s “SPI 1974–2004”?💬 Answer / discuss this question
D-02 — Failed season (cropping reliability)
📘 CRI Appendix Table 1 — verbatim definition
The failed season method was developed to assess and map drought risk by estimating the probability of a failed growing season. It is conservatively defined as one with sufficient rainfall at the start for germination and establishment, fewer than 50 growing days, and a clearly defined end. Thus, the failed season approach depends upon the use of a reliable means to assess the water-and temperature-constrained length of the growing period. The model can be used as a standardised index of cropping reliability, reported as percentages.
Verdict: Clarify — confirm source & role with B4T can’t finalise until the mis-cited source and production status are confirmed; a clear modern route exists if retained.
Measures: probability of a failed growing season — germination/establishment, then fewer than 50 growing days before season end. Reported as % cropping reliability; production-specific (a season “fails” when production cost exceeds harvest value).
- Dataset
- Unverifiable — cited “Hyman et al. 2025” is a mis-citation (arXiv 2503.17293 is a fisheries paper); likely intended Glenn Hyman (Alliance/CIAT), paper not locatable
- Resolution
- unknown
- Temporal
- “100 years” (per doc) · historic
- Scenario · CMIP
- N/A (observational)
- GCM ensemble
- N/A
- Access
- unknown
- Status
- conflicted — source & production status unconfirmed
- Dataset
- WRSI — L-WRSI (global, landscape-level) · crop-specific WRSI (FEWS regions) · GeoWRSI-on-CHIRPS (global crop-specific, derive)
- Access
- USGS FEWS · CHC GeoWRSI (GeoTIFF)
- Resolution
- L-WRSI landscape · crop-WRSI 0.1°
- Temporal
- L-WRSI 1982–present · crop-WRSI 2001–present
- Scenario · CMIP
- N/A (observational)
- GCM ensemble
- N/A
- Licence
- CC0 (L-WRSI, USGS)
- CDH action
- Clarify first; if retained, GeoWRSI-on-CHIRPS for global crop-specific (same stack as D-01)
📄 Provenance, licence & sources
- WRSI (FAO / USGS FEWS NET / CHC GeoWRSI), verified 2026-07-02: WRSI = seasonal AETc/PETc; WRSI < 50 = crop failure — a direct operational analogue of “failed season.”
- L-WRSI (landscape): global GeoTIFF, dekadal, 1982–present, CC0 — landscape-level, not crop-specific.
- Crop-WRSI (CHIRPS-Croplands): crop-specific, 0.1°, dekadal, 2001–present — but regional only (E/S/W Africa, C. America, Caribbean). Global crop-specific = run GeoWRSI on CHIRPS (a derivation, same stack as the D-01 SPEI route).
- FAO GAEZ v4, verified 2026-07-02: water-balance LGP, dry/rain days, ET deficit, reliability; ~9 km (5 arc-min); historical 1961–2010 + future 2011–2040/41–70/70–99; CMIP5-era (v5 is the CMIP6 successor).
Alternatives: FAO GAEZ growing-period / reliability (open, ~9–10 km, historical + future); CDH internal water-balance v2 (NDWS/NDWL). Overlap (Phase 2): failed-season overlaps the LGP-flip rows and drought — confirm it is a distinct, needed input (double-count risk). Keep the production cost-vs-value test as a B4T economic assumption, separate from the climate layer.
💬 Comments on “Failed season (D-02)”
Questions for B4T. What is the correct source for the failed-season method? Is it active in the production CRI? How does it relate to the LGP rows and the drought layer (overlap)?💬 Answer / discuss this question
Aqueduct 4.0 (shared) — D-03, D-04, D-05 (drought) · R-04, R-05 (changed rainfall)
📘 CRI Appendix Table 1 — verbatim definitions
Available blue water (in cm/year): the total amount of renewable freshwater available to a sub-basin with upstream consumption removed. Computed as internal sub-basin runoff plus the accumulated water flowing into the sub-basin from upstream, where upstream consumption is already removed (i.e., discharge). This includes freshwater from surface flow, interflow, and groundwater recharge.
Gross water demand is the maximum potential water required to meet sectoral demand, and net consumption is the portion of demand that is lost in use - evaporated or incorporated into a product - and not returned to the system, for four sectors: domestic, industrial, irrigation, and livestock. The (2x4=) 8 gridded data sets are available for each month between January 1960 and December 2019.
The baseline water stress (in cm/year) measures the ratio of total water demand to available renewable surface and groundwater supplies. Water demand includes domestic, industrial, irrigation, and livestock consumptive and nonconsumptive uses. Available renewable water supplies include the impact of upstream consumptive water users and large dams on downstream water availability. Higher values indicate more competition among users.
Intra-annual variability for three 30-year periods centred on milestone years 2030, 2050, and 2080. Measures the average between-year variability of available water supply, including both renewable surface and groundwater supplies. Higher values indicate wider variations in available supply from year to year.
Seasonal variability measures the average within-year variability of available water supply, including both renewable surface and groundwater supplies. Higher values indicate wide variations in the available supply within a year.
Verdict: Keep — on Aqueduct 4.0 (CMIP6); confirm version light touch if already on 4.0/CMIP6; the one open action is confirming the running version.
Measures: five WRI Aqueduct water indicators — D-03 available blue water; D-04 gross water demand / net consumption (8 monthly sectoral sets, 1960–2019); D-05 baseline water stress; R-04 intra-annual variability; R-05 seasonal variability.
Version uncertain: B4T notes “seems CMIP5 is being used in the CRI, but Aqueduct v4.0 is available using CMIP6” — so the current layers may be a CMIP5-era Aqueduct. The spec below is the CMIP6 4.0 target.
- Dataset
- WRI Aqueduct 4.0 — 5 water-quantity indicators (hydrology model PCR-GLOBWB 2)
- Access
- WRI data page · Google Earth Engine
- Resolution
- sub-basin (hydrological unit)
- Temporal
- baseline GCM historical 1960–2014 (bias-corrected) · future 2030 / 2050 / 2080
- Scenario · CMIP
- SSP1-2.6 / SSP3-7.0 / SSP5-8.5 · CMIP6
- GCM ensemble
- 5 GCMs — GFDL-ESM4, IPSL-CM6A-LR, MPI-ESM1-2-HR, MRI-ESM2-0, UKESM1-0-LL
- Licence
- CC-BY 4.0
- CDH action
- Keep — catalogue as-is · effort Low · confirm running version is 4.0/CMIP6 (not CMIP5-era) + scenario/period slice
📄 Provenance, licence & sources
- WRI Aqueduct 4.0 (Kuzma et al. 2023), verified 2026-07-02: hydrology PCR-GLOBWB 2 forced by CMIP6; baseline GCM historical 1960–2014 (future 2015–2100), bias-corrected; future periods 2030/2050/2080; scenarios SSP1-2.6, SSP3-7.0, SSP5-8.5; 5 GCMs, sub-basin unit; open (WRI, GEE; CC-BY 4.0).
- Confirms the “retain if CMIP6” condition. Open questions for B4T: which version (4.0 vs a CMIP5-era one), which scenario + period, ensemble vs single GCM, exact layers/aggregation used in the CRI.
💬 Comments on “Aqueduct water (D-03/04/05)”
Questions for B4T. Confirm the Aqueduct version (4.0/CMIP6, not CMIP5-era); which scenario + period; 5-GCM ensemble vs single model; exact indicator layers used; and harmonise the 2030 horizon with the CRI's other future layers.💬 Answer / discuss this question
F-01 — Dartmouth flood frequency (historic)
📘 CRI Appendix Table 1 — verbatim definition
Derived from the Global Flood Frequency and Distribution of the Dartmouth Flood Observatory. The data were computed from a global listing of extreme flood events between 1985 and 2003 (poor or missing data in the early to mid-1990s), compiled by Dartmouth Flood Observatory and georeferenced to the nearest degree. The resultant flood frequency grid was then classified into 10 classes of approximately equal number of grid cells. The greater the grid cell value in the final data set, the higher the relative frequency of flood occurrence.
Verdict: Replace — Global Flood Database a modern satellite-observed successor to the same Dartmouth lineage.
Measures: historic flood-frequency proxy — relative frequency of flood occurrence per pixel. Observational, no future element.
- Dataset
- Dartmouth Flood Observatory event catalogue (Dilley 2005, top-two-deciles)
- Resolution
- nearest degree (→ 0.05° grid)
- Temporal
- 1985–2003 · historic
- Scenario · CMIP
- N/A (observational)
- GCM ensemble
- N/A
- Access
- legacy / internal
- Status
- coarse & dated; poor data early-mid 1990s
- Dataset
- Global Flood Database (Tellman et al. 2021) — 913 satellite-observed flood events, 169 countries
- Access
- Google Earth Engine (Cloud to Street)
- Resolution
- ~250 m (MODIS)
- Temporal
- 2000–2018 · observed
- Scenario · CMIP
- N/A (observational)
- GCM ensemble
- N/A
- Licence
- CC-BY-NC 4.0 (GEE) — non-profit OK; use GEE, not the No-Derivatives HydroShare mirror
- CDH action
- Ingest; derive per-pixel flood-frequency · effort Low
📄 Provenance, licence & sources
- Global Flood Database (Tellman et al. 2021, Nature), verified 2026-07-02/03: satellite-observed flood extents, 913 events / 169 countries, 2000–2018, MODIS ~250 m; via Google Earth Engine + Cloud to Street. Licence CC BY-NC 4.0 (GEE) / CC BY-NC-ND (HydroShare) — non-commercial (usable by CGIAR as a non-profit; use GEE, avoid the ND mirror). Modern analogue for the F-01 Dartmouth proxy.
- Google Flood Hub “Inundation History” (secondary), verified 2026-07-03: per-pixel inundation frequency, 1999–2020, 128 m, CC-BY 4.0 — a repackaging of GLAD Global Surface Water Dynamics (Landsat, 30 m→128 m). A surface-water-occurrence product, not a flood-event catalogue; complements the Global Flood Database, does not replace it.
Secondary option: Google Flood Hub “Inundation History” — per-pixel frequency of inundation (1999–2020, 128 m, wet ≥5 / ≥1 / ≥0.5% = High/Med/Low), Google Cloud Storage, CC-BY 4.0. Its README confirms it is a repackaging of the GLAD Global Surface Water Dynamics dataset (Pickens et al. 2020, UMD; Landsat 5/7/8, 30 m native → 128 m, smoothed) — i.e. a surface-water-occurrence product (peer of JRC Global Surface Water), not a flood-event catalogue, coverage band excludes far north/south. Useful context; complements GFD, doesn't replace it. (Distinct from Flood Hub's operational Sentinel-1/2 nowcast model.)
💬 Comments on “Flooding proxy (F-01)”
Question for B4T. Keep an observed flood-frequency proxy, or move the flood hazard entirely to a modelled return-period product (GIRI / Aqueduct Floods)?💬 Answer / discuss this question
Flood hazard (shared) — F-02 river · F-03 coastal (Aqueduct Floods)
📘 CRI Appendix Table 1 — verbatim definitions
River hazard (RCP 8.5) simulates the water volume that resides in the flood plains of rivers at each time step. The future climate conditions were simulated using global climate models forced with representative concentration pathways (RCPs). The input data for the hazard simulations were sourced from the Impact Model Intercomparison Project (ISI-MIP) forcing data from 2010 to 2049. Bias correction was used for rainfall data. The pixel value represents in meters above ground level for a 1-in-10 annual probability flood event.
Coastal flood risk assessment, including future impacts of sea level rise, The hazard layers have been simulated without considering the presence of flood protection. To estimate the coastal hazard, the model utilized the Global Tide and Surge Reanalysis (GTSR) dataset as a database of extreme water levels recorded from 1979 to 2014. To translate near-shore tide and surge levels to overland inundation, a GIS-based inundation routine was used. The routine inundates areas that are hydraulically connected to the sea during a given extreme sea level event. The model uses the Multi-Error-Removed Improved-Terrain (MERIT) DEM at a 30"x30" resolution as an underlying topography. The pixel value represents in meters above ground level for a 1-in-10 annual probability flood event.
Verdict: Modernize CMIP5 → CMIP6 current Aqueduct Floods is RCP/CMIP5-era; move to a CMIP6/SSP flood product.
Measures: WRI Aqueduct Floods (Ward et al. 2020) — a 1-in-10-year flood hazard, no protection assumed. Two layers: F-02 river, F-03 coastal.
F-02 — river flood hazard
- Dataset
- WRI Aqueduct Floods — riverine (ISI-MIP forcing)
- Resolution
- ~30″ (pending confirm)
- Temporal
- future 2030 (input 2010–2049)
- Scenario · CMIP
- RCP8.5 · CMIP5-era (ISI-MIP)
- GCM ensemble
- multi-model (ISI-MIP)
- Access
- WRI · Google Earth Engine
- Status
- CMIP5-obsolete
- Dataset
- GIRI riverine (CIMA/UNEP-GRID) — probabilistic fluvial hazard
- Access
- giri.unepgrid.ch (registration form)
- Resolution
- 90 m
- Temporal
- baseline + SSP future periods
- Scenario · CMIP
- SSP1-2.6 & SSP5-8.5 · CMIP6
- GCM ensemble
- single GCM (IPSL-CM6A-LR)
- Licence
- non-commercial + attribution (registration) — non-profit OK
- CDH action
- Ingest · effort Med · trade-off: single-GCM vs Aqueduct's multi-model (but CMIP5)
📄 Provenance, licence & sources
- WRI Aqueduct Floods (Ward et al. 2020), verified 2026-07-02: riverine + coastal, 1-in-X return periods, baseline 1980 + future 2030/50/80; scenarios RCP4.5 & RCP8.5 (AR5 / CMIP5-era); ISI-MIP multi-model; open (WRI, GEE). CMIP5-era → modernization candidate.
- GIRI (CIMA / UNEP-GRID), verified 2026-07-03: fully probabilistic global flood hazard, riverine (fluvial) only; 90 m; CMIP6 SSP1-2.6 & SSP5-8.5, IPSL-CM6A-LR (single GCM, ISIMIP3b); free via registration (non-commercial + attribution). Use for F-02 (river) only; single-GCM ensemble.
- F-03 coastal: no ready open CMIP6/SSP coastal inundation-extent product. Copernicus CDS sea-level-change indicators (Muis 2023) = CMIP6 SSP5-8.5 water-level indicator (tides/surge/return periods), CC-BY — but not flood extent; the open CMIP6 driver to build a coastal layer (Phase-2). Keep Aqueduct Floods coastal (CMIP5) short-term.
F-03 — coastal flood hazard
- Dataset
- WRI Aqueduct Floods coastal — MERIT DEM 30″ + GTSR water levels
- Resolution
- MERIT DEM 30″ → 0.05° grid
- Temporal
- baseline 1979–2014 · SLR projection 2030
- Scenario · CMIP
- RCP · CMIP5-era
- GCM ensemble
- multi-model
- Access
- WRI · Google Earth Engine
- Status
- CMIP5 — no CMIP6 upgrade exists
- Dataset
- No ready CMIP6 inundation layer. Driver = Copernicus CDS “sea level change indicators” (Muis 2023) — extreme-sea-level / surge indicators, not flood extent
- Access
- Copernicus CDS
- Resolution
- ~2.5 km coastal (0.1°)
- Temporal
- epochs to 2021–2050
- Scenario · CMIP
- SSP5-8.5 · CMIP6 HighResMIP
- GCM ensemble
- HighResMIP ensemble
- Licence
- CC-BY
- CDH action
- Phase-2 build a coastal-hazard layer on the driver; keep Aqueduct Floods coastal (CMIP5) meanwhile
Cross-checks: Kirezci 2020 is CMIP5/RCP and not openly packaged; GIRI is riverine-only. Harmonise the return-period/horizon with the rest of the CRI.
💬 Comments on “Flooding return period (F-02/03)”
Questions for B4T. Which return period does the CRI use (1-in-10)? Is CMIP6 currency (GIRI) or multi-model breadth (Aqueduct Floods) the priority? Confirm the current Aqueduct Floods version/scenario in use.💬 Answer / discuss this question
Changed-rainfall LGP flips (shared) — R-01 (>120 d) · R-02 (>90 d)
📘 CRI Appendix Table 1 — verbatim definitions
Changed in rainfall is mainly defined by the length of the growing period (LGP). LGP 5% is set by the average number of days per year, in which a growing day is one in which the average air temperature is greater than 6 degrees C and the ratio of actual to potential evapotranspiration exceeds 0.35. Areas where the length of the growing period flips from >120 days per year to <120 days per year.
Changes in rainfall are mainly defined by the length of the growing period (LGP). LGP 5% is set by the average number of days per year, in which a growing day is one in which the average air temperature is greater than 6 degrees C and the ratio of actual to potential evapotranspiration exceeds 0.35. Areas where the length of the growing period flips from >90 days per year to <90 days per year.
Defined by the length of the growing period (LGP). LGP 5% is set by the average number of days per year, in which a growing day is one in which the average air temperature is greater than 6 degrees C and the ratio of actual to potential evapotranspiration exceeds 0.35. Areas where length of growing period flips from >120 days per year to <120 days per year.
Verdict: Modernize CMIP5 → CMIP6 (GAEZ v5) legacy Thornton LGP layers → ready CMIP6 agro-climatic LGP.
Measures: length of growing period (LGP). R-01 flags LGP flipping >120→<120 days/yr by the 2050s; R-02 the >90→<90 threshold (growing day = mean air temp >6 °C and actual/potential ET > 0.35; R-02 per Nachtergaele et al. 2002).
- Dataset
- Legacy CCAFS/Thornton LGP threshold-flips (Jones & Thornton 2009/13/15)
- Resolution
- 0.05°
- Temporal
- baseline ~2000s → 2050s
- Scenario · CMIP
- RCP8.5 · CMIP5 (provenance uncertain)
- GCM ensemble
- 17 CMIP5 GCMs (Thornton, pers. comm.)
- Access
- legacy / internal
- Status
- pre-CMIP6/SSP — CMIP5-obsolete · conflicted
- Dataset
- FAO GAEZ v5 — “Total number of growing period days” (Growing Period sub-theme)
- Access
- FAO catalog — GeoTIFF · WMTS · Google Cloud Storage
- Resolution
- ~10 km
- Temporal
- historical 1981–2000, 2001–2020 · future 2021–2100 (4 periods)
- Scenario · CMIP
- 3 SSPs · CMIP6 AR6 (exact SSP codes to confirm)
- GCM ensemble
- multi-GCM · CMIP6 AR6 (count not confirmed)
- Licence
- CC-BY 4.0
- CDH action
- Derive threshold-flip from baseline-vs-future LGP · effort Med · internal alt: NEX-GDDP-CMIP6 v2
📄 Provenance, licence & sources
- FAO GAEZ v5 (FAO/IIASA, 2025), verified 2026-07-02/03: 2020 baseline; future = CMIP6 AR6 under three SSPs, four periods 2021–2100; 180+ variables incl. agro-climatic LGP — the exact R-01/R-02 construct. Published as “Total number of growing period days” (not literally “LGP”); GeoTIFF Int16, ~10 km (0.0833°), EPSG:4326, global, CC-BY 4.0; historical 1981–2000 & 2001–2020 + 3 SSPs × 4 periods. Thermal LGPt (Ta>5/10/20/30 °C) are separate layers. Caveat: exact SSP scenario codes not verifiable in reachable metadata — confirm before citing.
- NASA NEX-GDDP-CMIP6 v2 (internal CDH track): BCSD CMIP6 daily, 0.25°, multi-GCM, SSP, 1950–2100 — modernization route for the future-facing rows.
Why GAEZ v5: it computes LGP directly from an agro-climatic water balance — the exact construct — as a ready CMIP6 product. (Thermal LGPt Ta>5/10/20/30 °C are separate layers.)
Note — likely duplicate + overlap. T-03 (under High temperature) is word-for-word the R-01 LGP-flip — resolve before implementing. LGP adequacy also overlaps failed-season (D-02) and drought — a Phase-2 consolidation question.
💬 Comments on “LGP (T-02 / R-01)”
Questions for B4T. Confirm the LGP definition/threshold in production; is T-03 the same layer as R-01? Is coarser GAEZ (~9 km) acceptable, or derive at finer resolution from NEX-GDDP v2?💬 Answer / discuss this question
R-03 — Annual rainfall coefficient of variation (historic)
📘 CRI Appendix Table 1 — verbatim definition
Areas where the coefficient of variation of annual rainfall (the standard deviation divided by the mean, expressed as a percentage) is currently greater than the 75th percentile for the globe (28%).
Verdict: Re-derive on CHIRPS v3 modern open precipitation, same stack as D-01.
Measures: flags areas where the coefficient of variation of annual rainfall exceeds the global 75th percentile (28%). Historic; current variability used as a proxy for the future (little info on how variability itself changes).
- Dataset
- Observed rainfall (Dilley 2005 / Thornton)
- Resolution
- 0.05°
- Temporal
- historic (current used as future proxy)
- Scenario · CMIP
- N/A (observational)
- GCM ensemble
- N/A
- Access
- legacy / internal
- Status
- verified-current
- Dataset
- CHIRPS v3 — re-derive annual rainfall CV (same stack as D-01)
- Access
- CHC / UCSB (CHIRPS v3)
- Resolution
- 0.05°
- Temporal
- 1981–present
- Scenario · CMIP
- N/A (observational)
- GCM ensemble
- N/A
- Licence
- public domain + CC-BY 4.0
- CDH action
- Re-derive CV on CHIRPS v3 · effort Low · Phase-2: CMIP6 future-variability (GAEZ v5 / NEX-GDDP v2)
📄 Provenance, licence & sources
- CHIRPS v3 (CHC/UCSB), verified 2026-07-02: 0.05°, 60°N–60°S all longitudes, 1981–near-present; new CHIRP3 algorithm, IMERG v6 Final baseline, ~4× more gauges; licence public-domain + CC-BY 4.0.
- Current CRI method (B4T / Philip Thornton emails): CV of annual rainfall > global 75th percentile (28%); current variability used as a proxy for future.
💬 Comments on “Rainfall CV (R-03)”
Question for B4T. Keep the historic-CV-as-future-proxy design, or move to a CMIP6 future-variability metric?💬 Answer / discuss this question
T-01 — Extreme humid heat days (GEHE)
📘 CRI Appendix Table 1 — verbatim definition
Annual Global High-Resolution High Temperature Extreme Heat Estimates provide global 0.05 degrees (~5 km) gridded annual counts of the number of days on which the maximum Wet Bulb Globe Temperature (WBGTmax) exceeded dangerous hot-humid heat thresholds for the period 1983 to 2016. The thresholds are based on the International Standards Organization (ISO) criteria for occupational heat-related risk, defined as days where WBGTmax > 28, 30, and 32 degrees Celsius. This data set also includes the annual rate of change in the number of extreme humid-heat days that exceeded these thresholds. GEHE has a wide array of applications for mapping and quantifying extreme humid-heat dynamics over a 34-year time period and is the highest resolution data set of its kind to date.
Verdict: Keep — modern & open Tuholske GEHE is a current, open WBGT humid-heat product.
Measures: annual count of days with max Wet Bulb Globe Temperature (WBGTmax) above ISO thresholds (>28 / 30 / 32 °C) — physiologically-relevant humid heat; manually masked.
- Dataset
- Global Extreme Heat Estimates (GEHE) — WBGT on the CHC CHIRTS record
- Access
- NASA SEDAC / Earthdata (DOI 10.7927/hff0-k565)
- Resolution
- 0.05° (~5 km)
- Temporal
- 1983–2016 · observed
- Scenario · CMIP
- N/A (observational)
- GCM ensemble
- N/A
- Licence
- CC-BY 4.0 (commercial & non-commercial)
- CDH action
- Keep — catalogue as-is · effort Low · caveat: ends 2016 · pair CMIP6 future heat (NEX-GDDP v2) for the future slot (Phase-2)
📄 Provenance, licence & sources
- GEHE — Global Extreme Heat Estimates (Tuholske et al. 2023, NASA SEDAC), verified 2026-07-02: annual counts of days with WBGTmax above ISO thresholds (>28/30/32 °C) + annual rate of change; 0.05° (~5 km), 1983–2016, global; WBGT built on the CHC CHIRTS record. Licence confirmed 2026-07-03 (NASA CMR): CC-BY 4.0.
- Caveats: ends 2016 (no update-to-present); observational (no future) — pair with CMIP6 future heat (NEX-GDDP v2) for the future slot.
💬 Comments on “Heat window (T-01)”
Question for B4T. Is the 1983–2016 window acceptable, or is an update-to-present / future-heat pairing wanted?💬 Answer / discuss this question
T-02 — Growing-season Tmax flip over 30 °C
📘 CRI Appendix Table 1 — verbatim definition
Areas where the average maximum daily temperature flips from <30 degrees C to > 30 degrees C during the primary (or main) growing season, masked for areas where the length of the growing period is > 40 days per year.
Verdict: Modernize CMIP5 → CMIP6 legacy Thornton heat-threshold layer → CMIP6 from an internal track.
Measures: areas where growing-season mean daily Tmax flips from <30 °C to >30 °C, masked where LGP > 40 days (30 °C = critical threshold; Boote 1998, Prasad 2008).
- Dataset
- Legacy CCAFS/Thornton growing-season heat-threshold flip
- Resolution
- 0.05°
- Temporal
- baseline ~2000s → 2050s
- Scenario · CMIP
- RCP8.5 · CMIP5 (provenance uncertain)
- GCM ensemble
- 17 CMIP5 GCMs (Thornton, pers. comm.)
- Access
- legacy / internal
- Status
- CMIP5-obsolete · conflicted
- Dataset
- NASA NEX-GDDP-CMIP6 v2 (internal CDH track) — derive the growing-season Tmax-flip
- Access
- internal CDH projections track (bias-corrected downscaled CMIP6)
- Resolution
- 0.25°
- Temporal
- 1950–2100
- Scenario · CMIP
- SSPs · CMIP6 (confirm which SSPs ingested)
- GCM ensemble
- up to 35 GCMs
- Licence
- CC-BY 4.0 / CC0
- CDH action
- Derive flip (needs growing-season mask, reuse LGP rows') · effort Med · alt: GAEZ v5 thermal (ready, ~10 km)
📄 Provenance, licence & sources
- NASA NEX-GDDP-CMIP6 v2 (internal CDH track): BCSD CMIP6 daily, 0.25°, multi-GCM, SSP, 1950–2100. Route to derive a growing-season Tmax-flip (needs a growing-season mask, e.g. from the LGP/GAEZ work).
- FAO GAEZ v5 thermal-regime indicators (CMIP6, ready, ~9–10 km) = alternative. Thermal LGPt (Ta>5/10/20/30 °C) are separate layers.
💬 Comments on “Heat growing season (T-03)”
Questions for B4T. Confirm the growing-season definition + 30 °C threshold in production; internal NEX-GDDP derivation vs ready GAEZ v5 thermal?💬 Answer / discuss this question
Salinity, soil water & irrigation (off-the-shelf) — S-01/02, W-01–04, I-01
📘 CRI Appendix Table 1 — verbatim definitions
The Global Map of Salt-Affected Soils represents the spatial distribution of salt-affected soils with electrical conductivity ECe>2 dS/m and/or exchange sodium percentage EC>15% and/or pH>8.2.
Global Soil Salinity combines soil property map. Salinity is represented by index values of electrical conductivity (ECe) with values representing slightly saline (2-4), moderately saline (4-8), highly saline (8-16), and extremely saline (>16).
Water retention volume at 1500 kPa and depth from 30 to 60 cm represents the capacity of a soil to hold water (and air), which depends on the amounts and types of organic matter in sand, silt, and clay, as well as soil structure, or the physical arrangement of the particles. The data extracted from the WoSIS Soil Profile Database, together with data estimated by a random forest pedotransfer function (PTF-RF).
Available water capacity at depths of 30 to 60 cm represents the fraction of water that soil can store and release for plant use. It calculated as the difference between field capacity and permanent wilting point.
Rooting zone water storage capacity extends from the soil surface to the weathered bedrock and determines land-atmosphere exchange during dry periods. It is modelled based on the assumption that plants size their rooting depth such that the corresponding rooting zone water storage capacity is just large enough to maintain function under the expected maximum cumulative water deficit (CWD) occurring within a specified return period.
Plant-available soil water (PASW) is the amount of stored water available for plant use. It is broadly defined as the difference between soil water content at field capacity (FC) and wilting point (WP) in the root zone. The geospatial information used a global map of a soil water retention model at different depths (0, 30, 60, and 100 cm) and a map of saturated hydraulic conductivity (Ksat). For the determination of the climatic water content, the number of consecutive days without rainfall was determined using multi-source weighted ensemble precipitation records for 37 years.
Area Equipped with Irrigation represents spatial data with actively used irrigation and regions not actively cultivated but equipped with irrigation. It was developed using national and subnational irrigation statistics from 2000 to 2015 for 243 countries, drawn from an international database, national agricultural censuses, and government reports.
Verdict: Keep — off-the-shelf all seven are modern products from authoritative stewards; open access confirmed for all seven; one licence still to confirm on the GloSIS platform (S-01 GSASmap); no build needed. The work is cataloguing + consolidation, not replacement.
For these seven the recommendation is to keep the current dataset and catalogue it as-is — so Present and Recommended are the same dataset — except W-01 / W-02, where we recommend updating to the current SoilGrids 2.0. No CDH build. ("Present" = what the CRI uses now.)
| Row | Present — current dataset (CRI now) | Recommended | Resolution | Temporal | Licence · access |
|---|---|---|---|---|---|
| S-01 | FAO GSASmap (Omuto 2020) — salt-affected soils (ECe/ESP/pH) | Keep — same dataset, catalogue as-is | — | 1970–2005 | CC-BY 4.0 by FAO default (confirm) · GloSIS platform |
| S-02 | ISRIC Global Soil Salinity (Ivushkin 2019) | Keep — same; overlaps S-01 (clarify) | — | 1986–2016 | open · ISRIC file server |
| W-01 | ISRIC WoSIS (Batjes 2024) — water retention 1500 kPa | Update → SoilGrids 2.0 (newer version) | 250 m | 1918–2013 | CC-BY 4.0 · ISRIC |
| W-02 | SoilGrids250m (Hengl 2017) — available water capacity | Update → SoilGrids 2.0 (FC−WP) | 250 m | 1950–2016 | CC-BY 4.0 · ISRIC |
| W-03 | Stocker 2023 — rooting-zone water storage | Keep — same dataset | — | 2003–2018 | open · Zenodo |
| W-04 | Gupta 2023 — plant-available soil water | Keep — same dataset | 1 km | 1979–2016 | CC-BY 4.0 · Zenodo 6777126 |
| I-01 | Mehta 2024 — area equipped for irrigation | Keep — same; + projected AEI (Gao, SSP) for future | — | 2000–2015 | open · Zenodo |
Consolidation flags (Phase 2). Two overlaps to resolve: two salinity products (S-01 vs S-02) and four soil-water products (W-01 retention, W-02 AWC, W-03 rooting-zone, W-04 PASW) all describe soil water-holding capacity — likely more layers than the CRI needs. Confirm which are load-bearing rather than modernising all of them. B4T also notes the crop coping-capacity (CCC) soil-water term uses a soil water-balance model (waterlogging / water stress) with MapSPAM crops — confirm how the W-01…04 layers relate to it (possible overlap/double-count).
Recommendation. Keep all seven off-the-shelf (catalogue; update W-01/W-02 to SoilGrids 2.0; verify W-04's dataset link). No CDH build required. In Phase 2, consolidate the salinity pair and the soil-water quartet to what the index actually uses; add the projected AEI (SSP) if a future irrigation layer is needed.
💬 Comments on “Salinity / soil water (S, W)”
Questions for B4T. Are both salinity products needed (S-01 vs S-02)? Which of the four soil-water layers are actually used? Is a future irrigation layer (projected AEI) wanted?💬 Answer / discuss this question
📄 Provenance, licence & sources
- S-01 FAO GSASmap (Global Soil Partnership): salt-affected soils, ~257k national points / 118 countries, EC/ESP/pH at 0–30 & 30–100 cm, GeoTIFF via the GloSIS platform. Licence not printed inline — CC-BY 4.0 by FAO default policy, but a third-party-data carve-out may apply; confirm on the GloSIS record.
- S-02 ISRIC Global Soil Salinity (Ivushkin et al. 2019): remote-sensing salinity 1986–2016, random-forest + WoSIS; open (ISRIC file server). Overlaps S-01.
- W-01/02 ISRIC SoilGrids 2.0: global soil properties, 250 m, six depths, CC-BY 4.0; volumetric water content at 33/1500 kPa → water retention (W-01) + available water capacity (W-02).
- W-03 Stocker et al. 2023 (Nature Geoscience): rooting-zone water storage capacity + rooting depth; open, Zenodo 10885724.
- W-04 Gupta et al. 2023 (JAMES): potential + climatic plant-available soil water; open, Zenodo 6777126, CC-BY 4.0; four 1 km global rasters.
- I-01 Mehta et al. 2024 (Nature Water): Global Area Equipped for Irrigation 1900–2015 (on FAO GMIA); open, Zenodo 14219723. Projected AEI 2020–2100 under SSPs also exists (Zenodo 14177960).
Feedback & corrections
This is a draft for review. Spot an error, disagree with a call, have a suggestion or a question? Tell us — no GitHub account needed. Each submission becomes a tracked issue the coordinator triages.
Give feedback on any section. Pick the section, choose the type — correction · concern · suggestion · question · comment — and add your comments.
Prefer email, or want to attach a screenshot? email your feedback.
Version history
- v1.1 — 2026-07-14: incorporated B4T's answers (Bert Lenaerts, 2026-07-13) to 9 open questions — inline “✅ Answered” notes per card; evidence log updated with the new sources (RTBMaps/Hyman 2008, Aqueduct Floods v2, LGP definition, 30 °C refs).
- v1.0 — 2026-07-07: initial dataset review published and shared with the CRI authorship + CAP teams; 23 inputs audited, open questions routed to B4T.